
Automated reporting and KPI dashboards for Australian teams.
Automated reporting for Australian teams who are still copy-pasting numbers into spreadsheets on a Monday morning. We build the pipelines, scheduled reports and Power BI dashboards that replace the manual ritual - reliably, with an audit trail.
Recent reporting automation work

Furniture Court QR ordering system
Manual exhibition ordering was slow and error-prone
Result · QR-based ordering system supported a record sales event
Read the case study →
BI Sense - ETL & data warehousing
Daily batch reports taking hours, costing more than they should
Result · ~30× speed improvement · daily refresh down to ~10 minutes · multi-million row scale
Read the case study →From spreadsheets to scheduled reporting
The problem is rarely the data - it is the manual ritual around it. Someone exports a few files, rebuilds the same pivot table, and emails a number that is already a day stale and quietly wrong in two cells. Automated reporting replaces that with scheduled ETL and dashboards that run themselves, so the figures are current, consistent and trustworthy. The full pattern is in our automated reporting and KPI dashboard guide.
This is remote work by nature. Pipelines run on a schedule against your systems, and a dashboard is wherever your people already open it, so it makes little practical difference whether your team sits in Melbourne, Sydney, Adelaide, Perth, Canberra or here in Ipswich. Everything runs on AEST hours, and the handover is a call rather than a site visit.
Typical reporting automation scope
Scheduled reports
Daily, weekly and monthly reports emailed to the people who need them - in the format they actually read.
Live dashboards
Dashboards backed by properly modelled data - see ETL pipelines & data warehousing.
Data pipelines
ETL into a warehouse or lakehouse - see ETL pipelines & data warehousing.
Cross-system joins
Blend CRM, finance, inventory, marketing and ops data into a single source of truth.
Alerts & exceptions
Know when a number moves outside the normal range - without reading every report.
Self-serve access
Secure, governed access so teams get answers without a support ticket.
The pieces of an automated reporting system
- Scheduled Power BI exports - the reports people actually read, delivered on a schedule instead of on request
- SQL-driven summaries - figures derived from your source data, not hand-keyed, so they reconcile
- Near real-time dashboards - a current view of the numbers that matter, refreshed as often as the source allows
- Clear KPI definitions - agreed, documented metrics so everyone is reading the same number the same way
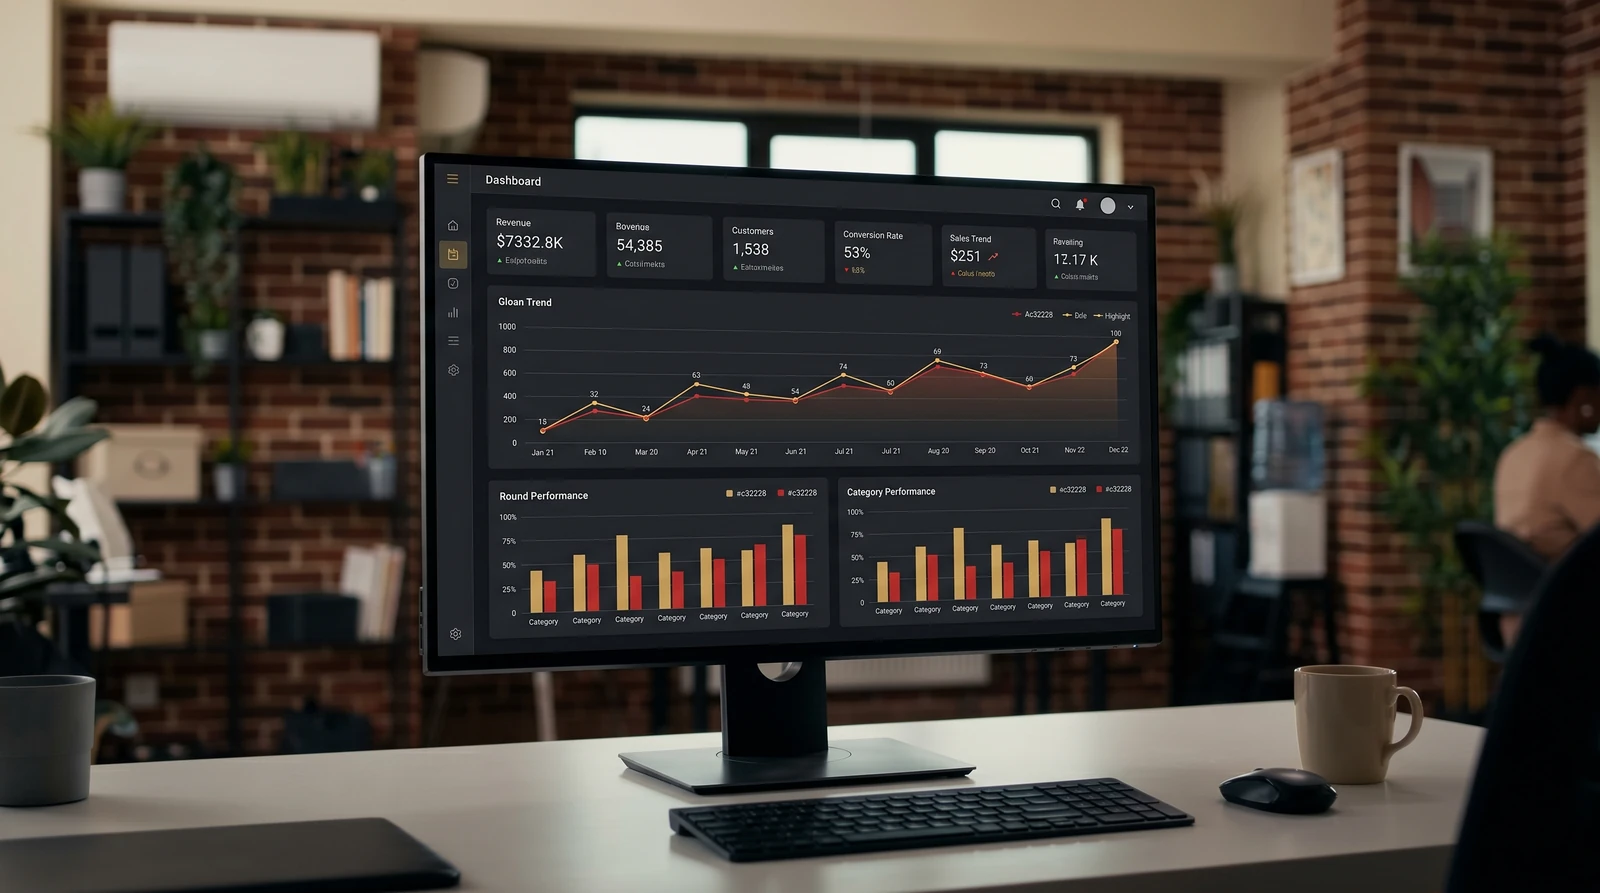
How fresh does the number need to be?
Not every report needs to be live. A monthly board pack is fine on a batch refresh; an operations dashboard that drives same-day decisions is not. We match the refresh cadence to the decision it supports - daily batch where that is enough, near real-time where the lag actually costs you. The trade-offs are covered in near real-time vs batch dashboards.
Reporting automation in practice
For BI Sense we cut a multi-million-row daily data refresh from hours to roughly ten minutes - about a 30× improvement in how quickly the numbers were ready each morning.
Reporting automation - common questions
The weekly spreadsheet someone rebuilds by hand. Reporting runs on a schedule from your source data, so the numbers are current and consistent without the manual work.
Yes - Power BI is common, backed by SQL-driven data so the figures are reliable. We also build in Tableau, and warehouse on SQL Server, Azure SQL, BigQuery, Snowflake or Databricks when your stack calls for it.
Yes, depending on the data source. We move teams from daily batch to near real-time where it is worth it - see near real-time vs batch dashboards.
Not always. For a few sources we can report straight from them; once you are joining several systems, need history kept, or live queries are slowing the source down, a warehouse makes refreshes faster, cheaper and more reliable. Where one helps, see ETL and data warehousing.
Yes. ETL and data warehousing prepares and models the data. Reporting automation delivers the dashboards, exports, summaries and alerts people actually use. A strong setup often needs both.
Reporting and Power BI work starts at $1,490, and it is quoted per engagement rather than as a monthly retainer. Where a project lands depends on how many source systems are involved, whether the data needs a warehouse behind it, and how often it has to refresh. Fixing a single slow dashboard refresh sits at the lower end; a full ETL pipeline, warehouse and semantic model sits well above it. See the pricing page for how that compares with the rest of our work.