
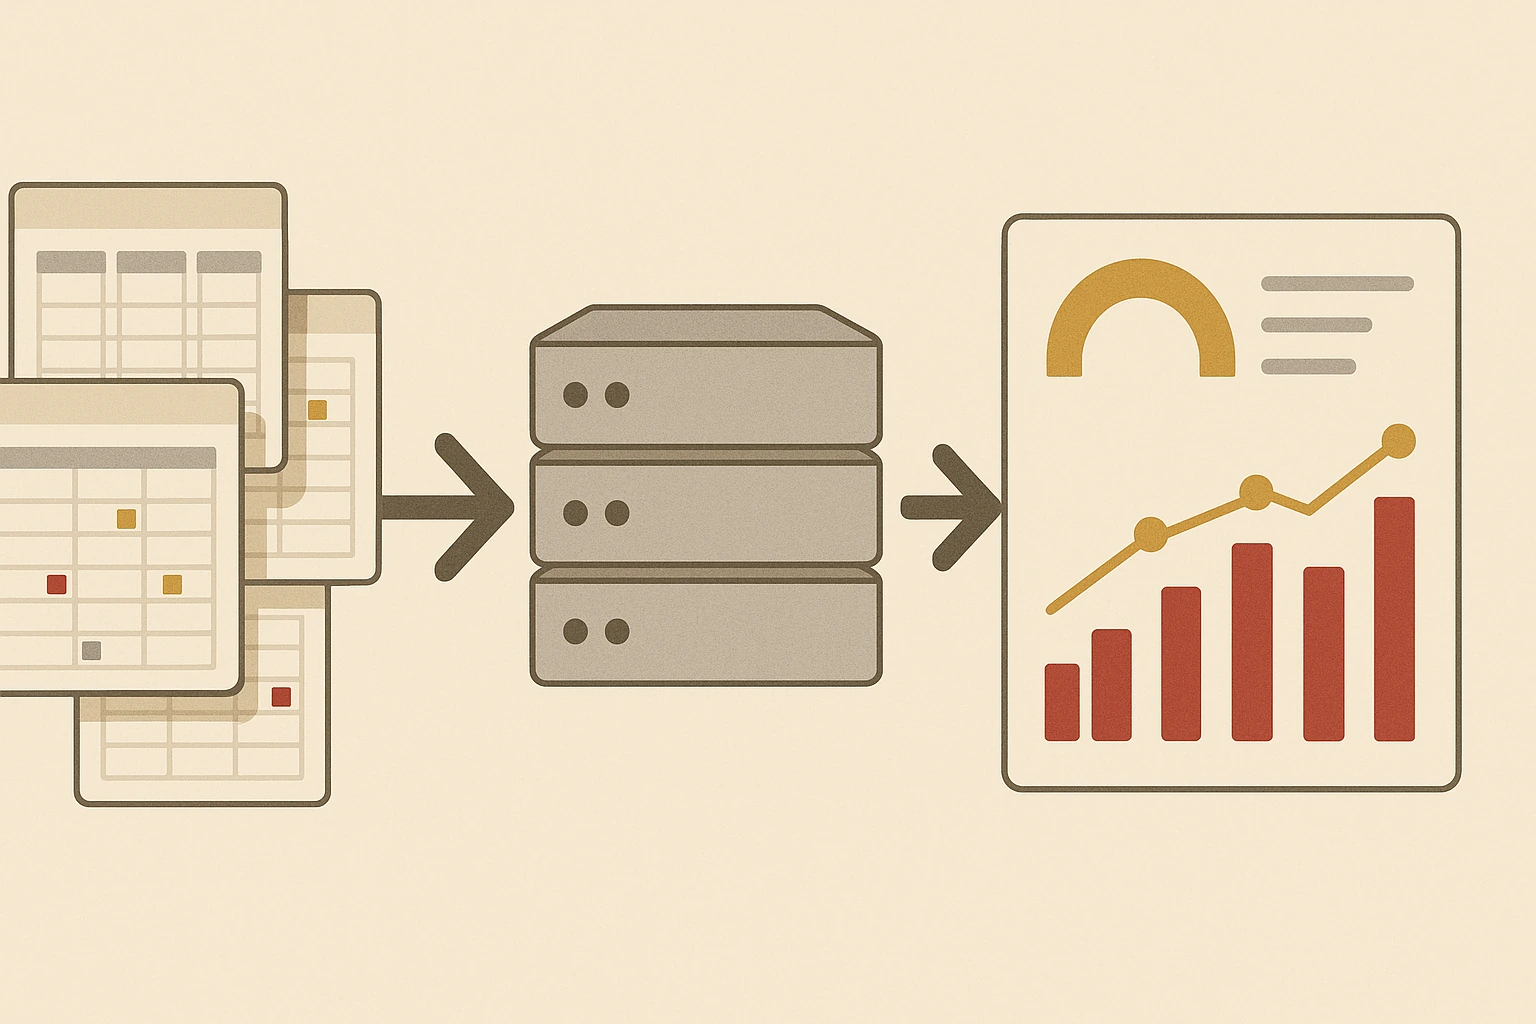
If the weekly report depends on someone downloading files, pasting columns and fixing formulas, that is not reporting, it is a ritual. Reporting automation replaces it with a scheduled pipeline: sources, ETL, a warehouse, a model and a dashboard. Automate the report you already have first, then improve it.
- The real problemManual steps and hidden formulas, not the spreadsheet itself
- What the stack needsSources, ETL, warehouse, model, dashboard
- Start fromThe decisions the report drives, not the charts
- Build orderAutomate the current report first, improve it second
- Where trust comes fromConsistency before cleverness
The problem is not the spreadsheet
Spreadsheets are useful. The problem is manual reporting built on fragile downloads, copy-paste steps, hidden formulas and one person who knows which tab to refresh first. That kind of reporting breaks quietly and erodes trust.
Reporting automation starts by separating the data pipeline from the dashboard. The pipeline collects, cleans and stores data. The dashboard presents it.
What the automated reporting stack usually needs
- Sources: CRM, WooCommerce, accounting, ERP, CSV exports or databases.
- ETL: extract, clean, validate and load data on a schedule.
- Warehouse: SQL-friendly tables designed for reporting.
- Model: measures, relationships, date tables and business definitions.
- Dashboard: Power BI reports with clear KPI hierarchy.
- Alerts: refresh failures and data anomalies visible before Monday morning.

Start with the decisions, not the charts
A dashboard should answer recurring business questions: sales by channel, margin by category, overdue invoices, quote conversion, order volume, fulfilment delays or campaign performance. If nobody can name the decision, the chart is decoration.
This is why our reporting automation work starts with the business rhythm, not just a visual theme.
ETL makes dashboards trustworthy
The BI Sense ETL case study shows the value of moving from slow, expensive API-heavy reporting to a structured warehouse and scheduled refresh. The result was faster reporting and a cleaner model that could scale.
Good ETL validates data, handles failures, retries safely and leaves an audit trail. Without that, a dashboard can look polished while being wrong.

Automate the report, then improve the report
Do not try to build the dream dashboard on day one. First automate the current report reliably. Then remove metrics nobody uses, add better definitions and improve the user experience. Trust comes from consistency before sophistication.
For related capability, see reporting automation and ETL and data warehousing.
FAQ
Reporting automation is the process of collecting, cleaning and refreshing reporting data on a schedule so dashboards and summaries do not depend on manual spreadsheet work.
Not always, but a warehouse helps when data comes from multiple systems, refreshes are slow or business logic needs to be consistent.
Yes. Many practical ETL projects start with scheduled CSV exports, then mature toward direct APIs or database connections later.
Ready to stop rebuilding the same report every week?
We design reporting pipelines, warehouses and Power BI dashboards that refresh reliably and match the decisions your team actually makes.