Case study · Website speed audit · Finance, Melbourne
How a thorough speed audit cut VIP Finance Group's load times by 94%
VIP Finance Group's WordPress website was still slow after a move to a bigger server. Our audit found seven reasons why, and not one of them was the server. We fixed them layer by layer, without changing a thing about the design.
vipfinancegroup.com.au · 14 pages · 84 tests · 12 days
vipfinancegroup.com.au/car-finance/
97Quick QuoteMobile score, was 36
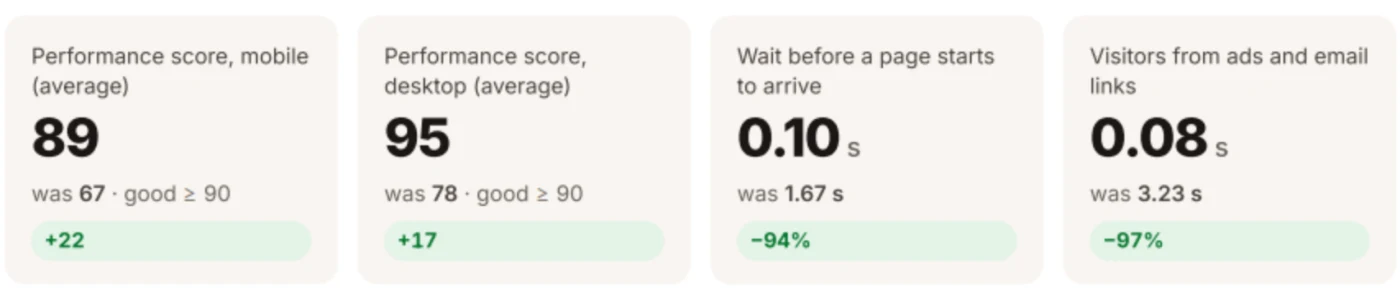
0.08sVisitors from ads and email, was 3.23 s
The live site on 1 November 2026. The design is VIP Finance Group's own and did not change.
95Desktop scoreAverage of 14 pages, was 78 +17
89Mobile scoreAverage of 14 pages, was 67 +22
0.10sUntil a page starts to arriveFrom Brisbane, was 1.67 s −94%
13 of 14Pages in Google's green zoneOn desktop, was none
The brief
A new server, and a website that still felt slow
VIP Finance Group arranges car, marine, equipment and personal finance from South Yarra in Melbourne. Its WordPress website is where new enquiries begin, through the Quick Quote and loan application forms. On its hosting company's advice, the site had just moved to a new, more powerful server. It still felt slow.
How they found us: the director's AI assistant pointed him to Lovely Pixel. He called at 9:30 that night, and the audit report was with him the next morning.
Client
VIP Finance Group
Business
Car, marine, equipment and personal finance broker, South Yarra, Melbourne
Website
WordPress with Elementor, Slider Revolution and Gravity Forms
Our role
Speed audit, staging proof, live optimisation and Cloudflare migration
Timeline
28 September to 10 October 2026
Since then
Ongoing SEO, and care of all four of the group's websites
The audit
We measured everything before we changed anything
Slow websites rarely have a single cause, so every speed project starts with a full audit. This one covered every page, both devices and the whole route from a visitor in Brisbane to the website.
235Web addresses crawled
14Unique pages tested, on mobile and desktop
84Google Lighthouse tests before a single change
7Causes found and ranked by impact
What the audit found
Baseline report · 29 September 2026
01Every request travelled to a security firewall in Paris and backDelivery415 ms round tripHigh impact
02A slider held back the banner headlineWordPressOn 8 of 14 pagesHigh impact
03Dozens of files had to load before anything appearedWordPress51 blocking filesHigh impact
04The quote and application forms jumped while loadingPageLayout shift 0.72Medium impact
05Heavy fonts and oversized imagesPage12 font filesMedium impact
06Third-party scripts on every pagePage681 KB of scriptsMedium impact
07Browsers were told to forget the site's files after a dayServer1-day cacheLower impact
Also checked: accessibility, best practices, SEO, redirects and security settings.
Not one of the seven could be fixed by a faster server.
That is why the new server hadn't helped, and why the fix had to work at every layer of the site.
The approach
Proved on a copy first, then applied, then measured again
01
Audit
29 September
A full crawl, 84 tests and a written report ranking every cause by impact.
02
Prove
2 October
The fixes built and tested on a private copy of the site, with every page compared screenshot by screenshot.
03
Apply
8 and 9 October
Applied to the live site one step at a time, each with its own undo. The website and email stayed up throughout.
04
Verify
9 and 10 October
The same 84 tests again, and a plain-English before-and-after report.
The work
Fixed at every layer, not just one
The audit found problems in four places, so the work covered all four. None of it changed how a page looks.
Delivery
Server
WordPress
Page
01Delivery
Served from Australia
Moved to Cloudflare, with servers in Brisbane and Sydney: a round trip of 11 ms instead of 415.
Visitors from ads and email links now get the cached page, like every other visit.
DNS moved record by record, so email carried on exactly as before.
02Server
Tuned, not replaced
OPcache switched on and the LiteSpeed page cache tuned.
Browsers now keep images, scripts and styles for 30 days instead of one.
The same hosting server, now set up to make the most of it.
03WordPress
A speed plugin built for this site
A custom must-use plugin, written around VIP Finance Group's own pages.
Each feature carries a fingerprint of what it was built from. If a page or plugin changes, that feature switches itself off, so an update can't break the look.
04Page
The first screen comes first
On all 14 pages, the styling for the first screen now travels inside the page.
On phones, the banner on the seven product pages appears straight away.
Fonts for the first screen load early; images further down wait until they're needed.
Space is reserved for the quote and application forms, so they no longer jump.
What stayed exactly the same
The design
The content
Every page and address
The hosting server
Page weight, about 1.1 MB
The results
Measured the same way, before and after
84 tests on 29 September and the same 84 on 9 October: the same pages, devices, location and version of Google Lighthouse.
95
Desktop scoreAverage of all 14 pagesWas 78 +17
89
Mobile scoreAverage of all 14 pagesWas 67 +22
97
Quick Quote formMobile scoreWas 36 +61
A typical page, fully loadedPhone test, measured from Brisbane
−94%94% less time
Before15.1 s
After0.8 s
Until a page starts to arriveTime to first byte, from Brisbane
−94%94% less time
Before1.67 s
After0.10 s
Visitors from ads and email linksUntil their page starts to arrive
−97%97% less time
Before3.23 s
After0.08 s
Main content on a mid-range phoneLighthouse simulation, typical page
−67%67% less time
Before10.5 s
After3.5 s
13 of 14 pages in Google's green zone on desktop, up from none
All 14 pages finish loading sooner, on phone and desktop
Forms no longer jump: layout shift 0.72 → 0.00
Round trip from Brisbane: 415 ms → 11 ms
Browser cache: 1 day → 30 days
How we measured. Google Lighthouse 13.5.0 with identical settings on both days: three runs per page per device, median reported, from Brisbane on the Optus network. Load times are as measured in the test browser on our office connection; network timings are the median of five fresh connections. These are lab tests, repeatable before and after a change. What each visitor sees varies with their device and connection.
97Mobile scoreWas 36 on 29 September
Where enquiries start
The Quick Quote form went from 36 to 97 on mobile
For a finance broker, the quote form is the page that matters most. It was the slowest page on a phone, and it jumped around while it loaded.
Mobile score 36 → 97, desktop 65 → 99
Main content on a simulated phone after 2.3 seconds, down from 8.1
No more jumping: layout shift 0.72 → 0.00
The Loan Application form followed: 60 → 96 on mobile and 60 → 99 on desktop
The evidence
Documented at every stage
Each stage ended with a plain-English report, so the client never had to take our word for anything.
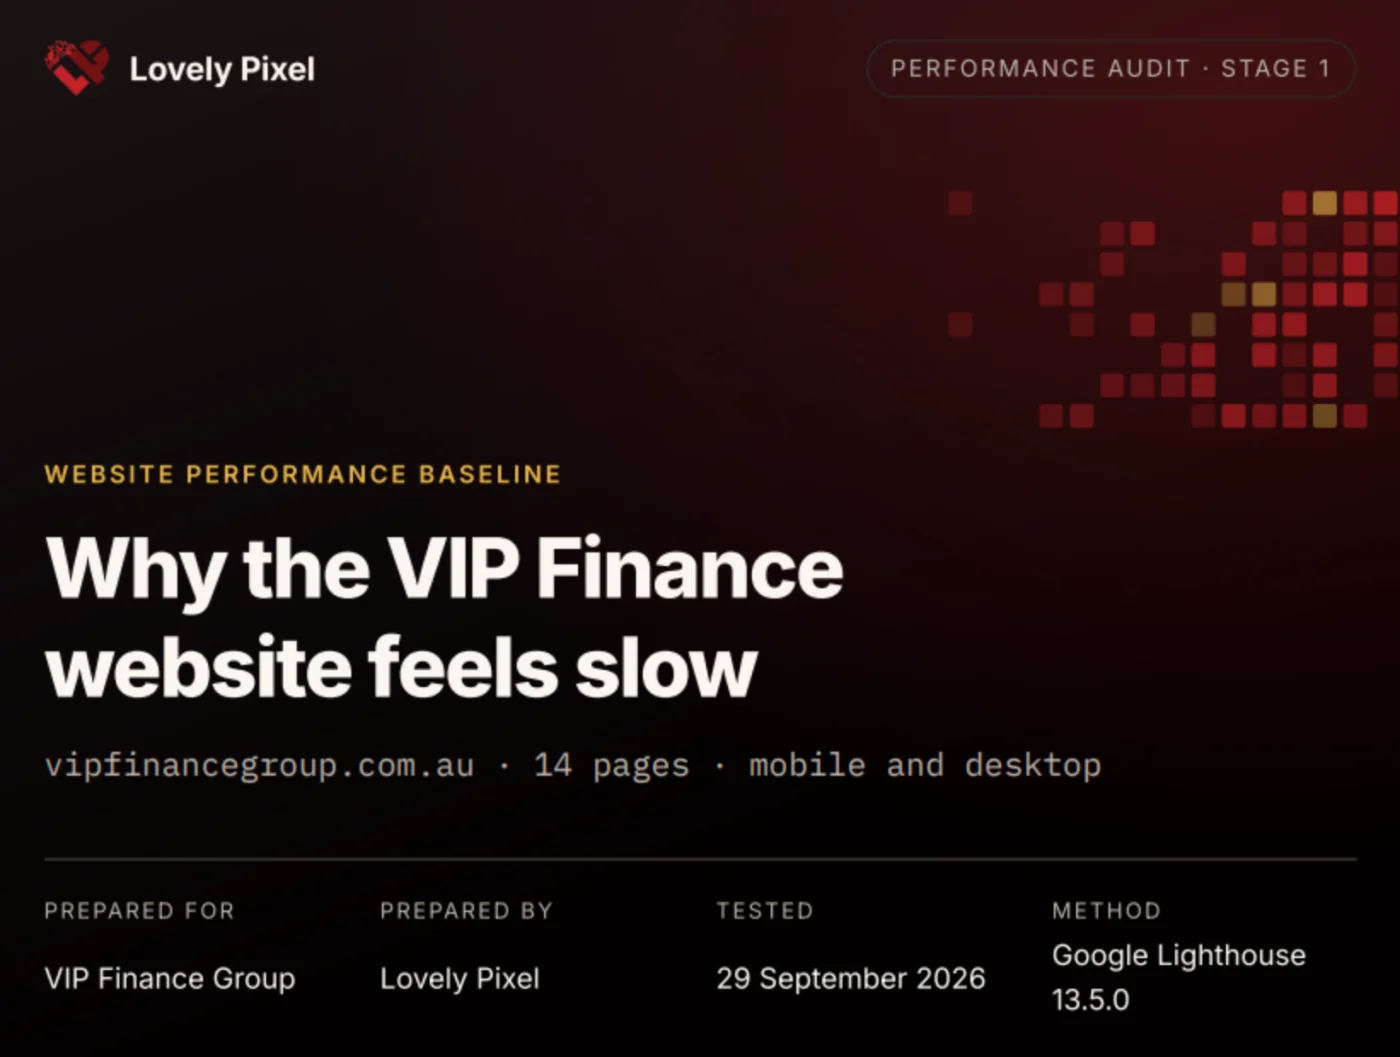
Stage 1 · 29 SeptemberThe audit: why the site was slow, seven causes ranked by impact, and the plan to fix them.
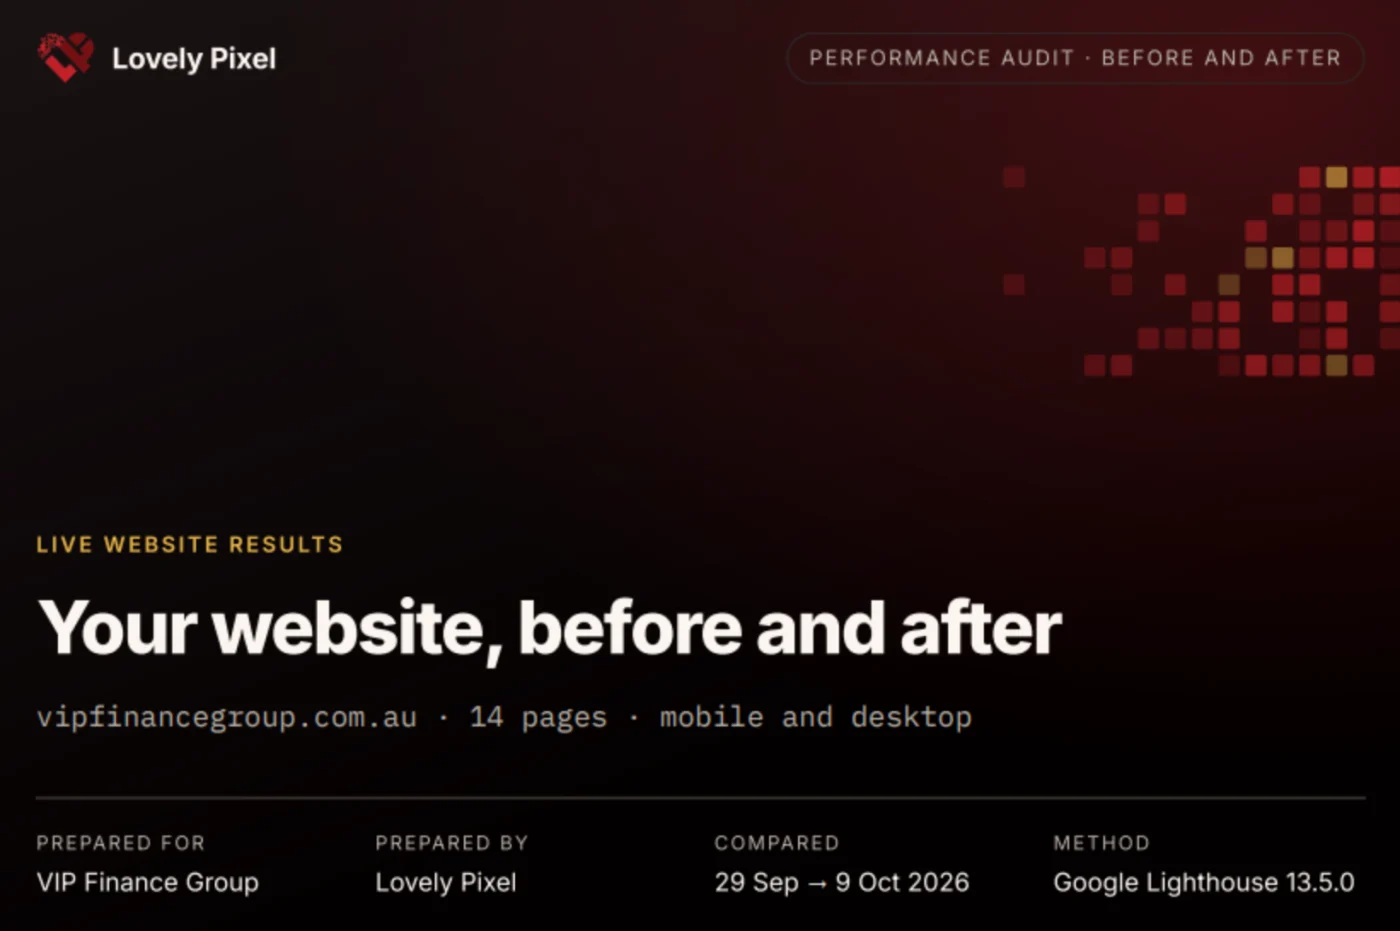
Stage 2 · 9 OctoberThe results: the same 84 tests, side by side with the baseline.
The key figures, as the client first read them in the final report.
4Websites now in our care
What happened next
From one speed project to all four of the group's websites
With the speed work finished on 10 October, VIP Finance Group asked us to take on its SEO and to look after all four of the group's websites. The SEO is measured the same way as the speed work: against a baseline recorded before anything changes, with the trend reported every month.
FAQ
Questions about this project
Everything between a visitor and the finished page. We crawled the whole site to find its 14 unique pages, ran 84 Google Lighthouse tests (three on mobile and three on desktop for every page), timed the server from Brisbane with repeated fresh connections, traced the route each request took, and checked redirects, caching and security settings. Accessibility, best practices and SEO were scored as well. The result was a written report that ranked seven causes by impact.
Because the server was not what held the site back. The audit found seven causes: requests routed through a security firewall in Paris, a slider holding back each banner headline, dozens of files loading before a page could appear, forms that jumped while loading, heavy fonts and images, third-party scripts and short browser caching. A faster server changes none of those, which is why we measure before recommending anything.
No. The design, content, pages and addresses are exactly as they were, and pages weigh about the same 1.1 MB, so nothing was stripped out to win points. We compared full-page screenshots of all 14 pages, on phone and desktop, before and after.
Twelve days from the first call to the final report. Every fix was proved on a private copy of the site first, then applied to the live site one step at a time, with full backups and an undo for each step. The website and email stayed up throughout. See how our WordPress speed optimisation works.
Website still slow after a hosting upgrade?
The cause is often somewhere else. We measure where the time goes before recommending anything, prove the fix on a copy of your site, and show you the before and after.
Based in Ipswich, working with businesses in Brisbane, Melbourne and across Australia.